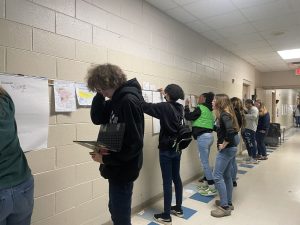
As part of their unit on labor and unemployment, senior economics students pretended they had been hired by the textbook company to update the labor statistics charts. Students chose from pie charts and bar and line graphs about unions, wages, earnings, etc. The students used the same source the textbook uses, the Bureau of Labor Statistics, to research the updated data and then create an updated chart. Students then made a comparison between the outdated chart in the textbook and the chart they created with the current data.